Pulse contour cardiac output measurement
This chapter is relevant to Section G6(iii) of the 2023 CICM Primary Syllabus, which expects the exam candidate to "describe the methods of measurement of cardiac output, including limitations, potential sources of error, the need for calibration and the values obtained". It has never been interrogated in the First Part exam, but it has appeared as Question 4 from the second paper of 2024 in the Second Part, where measurement principles and calibration of the continuous cardiac output were discussed.
\( \sqrt{ \dfrac{a^2 + b^2}{2} } \times \bigl( 1 \pm \sin\theta \bigr) \)
Measurement of Cardiac Output from Pulse Contour
The technique relies heavily on the compliance of the vascular tree. It requires to be calibrated by a thermodilution measurement. If the characteristics of the blood vessels change (i.e. if the patient becomes rather more vasoconstricted or vasodilated) the whole system needs to be recalibrated.
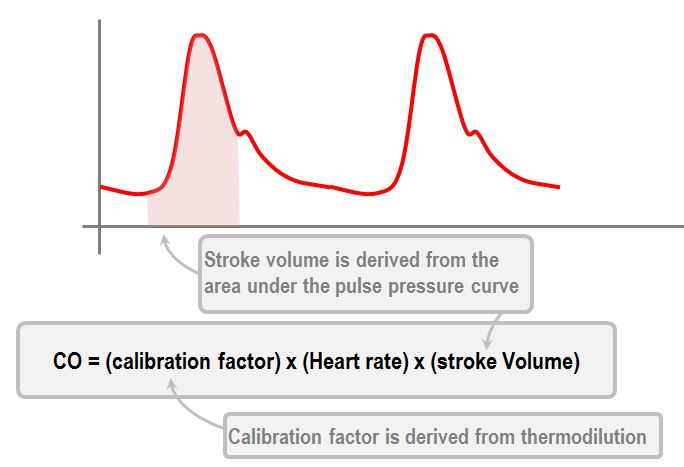
This level of explanation is all that is expected from the CICM exam candidate at any level of training, and we have some objective evidence to support this assertion. The reader in the final convulsive stages of exam apoplexy is therefore directed to memorise this one-line soundbite and move on to higher-yield syllabus items. What follows is a longform derivation of this concept, which is not essential for the routine user of these devices, nor for anybody preparing their exam notes. In fact it is not entirely obvious who the intended audience for this could be (which is perhaps true of the rest of this site). For those interested in the maths, but not interested in this author's uneducated interpretation of the maths, the best primary resources are Jansen et al (1990), Bernstein (2008), Cerutti et al (2001) and above all Wesseling et al (1993).
Principles of pulse contour cardiac output measurement
Pressure can be conceptualised as the driving force behind flow, and therefore from pressure, flow can be determined, as long as resistance is known. If one thinks of it in those terms, it suddenly takes on a familiar simple Ohmian appearance:
Q̇ = P/R
where
- Q̇ = flow
- P = pressure difference
- R = resistance
This is the flow rate at any given instant. Pressure in the arterial circulation is easy to measure, but the resistance is not quite so straightforward, as the opposition to flow in the arterial circulation is a composite of multiple characteristics:
Q̇ = P/something
where
- Something =
- characteristics of the arterial circulation that reflects its ability to be compliant, elastic, and capable of storing blood, reflecting pressure waves, and changing the opposition to flow dynamically with the changing pressure of the pulse.
Plus we need to remember that this Q̇ is still a measure of flow at any given instant, and that to calculate volume we need to incorporate time somehow. We do this by multiplying both sides of the equation by time (flow being volume divided by time, which means
SV = P × t / something
where
- SV = stroke volume
- t = the duration of systole
The arterial characteristic "something" does not need to be multiplied by time to remain valid here because we assume that these variables do not change dramatically over the course of a single systole. But, P × t only gives us a valid volume when the P is constant, i.e. the area under this graph is a perfect rectangle, and the circulation does not work like that. Ergo, the P × t relationship is the integrated area under the arterial systolic pressure curve:
SVpc = ∫asys / someting
Where
- SVpc is the SV calculated from the pulse contour, and
- ∫asys is the area under systolic portion of arterial waveform trace
So, this is the stroke volume which is calculated from the raw untreated contour of the pulse pressure curve, divided by the characteristics of the arterial circulation. Unfortunately those characteristics are a difficult value to estimate or measure, but we do have some empirical methods of predicting it, for example those imagined by Langewouters et al (1984) and Wesseling et al (1993). This "something" can be represented as Cw, the aortic compliance (where the little "w" is for "Windkessel"), Rp the peripheral arterial resistance (the "p" is for Poiseuille) and Zao the aortic impedance, where the Z came from electrical engineering (again), which means it has no history and appears to have been shaped from primordial smoke by the Ainur.
These variables obviously all have various ways to calculate them:
Cw = lC'
where
- l is the length of the aorta, about 80cm for most adults
- C' is the derivative of the change in crossectional area of the aorta according to changes in pressure, i.e. dA/dP
Zao = √ρ / (AC')
where
- ρ is the density of the blood,
- A is the crossectional area of the aorta,
Rp = (8 l η) / πr4,
where:
- l = length of the vessels (all the vessels)
- η = viscosity of the blood
- r = radius of the all the vessels
Yes, you could try to calculate these, but realistically this would be a pain in the hole. Specifically, it is probably better to accept that Zao can never be accurately computed. All we can do is estimate it from heart rate and MAP data using a whole range of empirically derived age correction factors, represented as a, b, c and d in this equation:
Zao(estimated) = a / (b + (c × MAP) + (d × HR))
In this fashion we can produce a relatively inaccurate ballpark estimate of the stroke volume:
SVpc = Asys / Zao(estimated)
where
- SVpc is the uncalibrated SV calculated from the pulse contour, and
- Asys is the area under the systolic pressure-time curve
But ballpark accuracy seems insufficient for high stakes decisions. Fortunately, we can get stroke volume from a thermodilution measurement, and compare to this computed ballpark value, thereby calculating the correction factor:
Zao = SVpc / SVtd
where
- SVpc is the uncalibrated SV calculated from the pulse contour, and
- SVtd is the actual stroke volume measured by thermodilution
And now that you're committed to doing a thermodilutioin cardiac output measurement, you can get the other components of the model. Rp is the SVR, innit. And Cw can probably be guessed reasonably accurately from the exponential decay time of the arterial pressure curve during arterial diastole, divided by the SVR (Litton & Morgan, 2012). This rests on the premise that pressure in diastole will decay exponentially with a characteristic decay time. Observe: compliance links volume changes to pressure changes, as:
dV = dP × C
In other words, the change in aortic volume is the change in aortic pressure multiplied by the aortic compliance in ml per mmHg. This change in volume, during diastole, is a negative flow, - Q:
-Q = dP × C
Because we remember that Q = P/R, it is fair to rearrange this relationship as
-P/R = dP × C
We are looking at changes of pressure over time, which means
-P/R = dP/dt × C
Rearranging to move C to the other side, we divide both sides by C:
(-1/RC) × P = dP/dt
This is a first order differential equation, where the variable P is changing according to the coefficient k over time t, as:
dP/dt = -kP
or
P(t) = P0e−kt
where
- P0 is the pressure at the beginning of diastole, and
- -kt is the time constant
In our case, k = -1/RC, so
P(t) = P0e−t/RC
This is the standard exponential decay form, y(t)=y0e−t/τ and so RC = τ, the decay time constant. In other words, resistance (in this case SVR) multiplied by compliance (C) describes the rate of decay of the diastolic pressure curve, which means
Aortic compliance (Cw) = Diastolic exponential decay time constant τ / Systemic vascular resistance
Voila.
Was this necessary? No. Was this interesting to read? Also, no. The benefit to the two or three weirdos who will benefit from this page in the next twenty years is surely matched by the shame experienced by the author's mathematically inclined ancestors, all of whom tsk disapprovingly from beyond the grave at the sloppy maths and unskilled explanations. The reader who has made it this far can be reassured with the knowledge that nobody anywhere will ever be expecting them to remember any of this. The most important points are:
- The pulse contour is related to the cardiac output
- The factors that influence this relationship are largely unpredictable, and need to be empirically measured
- These factors include:
- The characteristics of the blood (eg. haematocrit, as a measure of viscosity)
- The characteristics of the vessels, some of which are largely fixed (i.e.your aorta) and some of which can fluctuate randomly across the span of an hour (eg. the peripheral vascular resistance)
- The upshot of these unpredictable influences is the need to recalibrate any derived cardiac output estimates based on the pulse contour against some measured standard, for example an actual cardiac output recorded through thermodilution.
Apart from this, the next most obvious limitation of pulse contour analysis are related to the irregularity and unreliability of the human heart, and its tendency to modulate its beat in tune to the needs of the organism, which is extremely inconsiderate of the time and efforts expended by people trying to measure it. Pulse amplitude and the shape of the pulse waveform varies with many circulatory phenomena which are either completely unrelated to the cardiac output (eg. transducer damping), or are related but completely erratic and unpredictable (eg. the randomness of atrial fibrillation), or are related and predictable but which by their very design obscure all evidence of cardiac performance (eg. the intra-aortic balloon pump). And then there is the nonpulsatile flow of ECMO. In short, the accuracy of measuring cardiac output with pulse pressure cardiac output devices rests on the totally sound premise that the circulatory system of the haemodynamically unstable patient will behave in a totally predictable manner and do nothing surprising over the course of the measurements, producing cookie-cutter waveforms with metronomic regularity.
References
Hadian, Mehrnaz, et al. "Cross-comparison of cardiac output trending accuracy of LiDCO, PiCCO, FloTrac and pulmonary artery catheters." Critical care 14 (2010): 1-10.
Oren-Grinberg, Achikam. "The piCCO monitor." International anesthesiology clinics 48.1 (2010): 57-85.
Litton*, E., and M. Morgan. "The PiCCO monitor: a review." Anaesthesia and intensive care 40.3 (2012): 393-408.
Langewouters, G. J., K. H. Wesseling, and W. J. A. Goedhard. "The static elastic properties of 45 human thoracic and 20 abdominal aortas in vitro and the parameters of a new model." Journal of biomechanics 17.6 (1984): 425-435.
Wesseling, K. H., et al. "Computation of aortic flow from pressure in humans using a nonlinear, three-element model." Journal of applied physiology 74.5 (1993): 2566-2573.
Nichols, WILMER W., et al. "Input impedance of the systemic circulation in man." Circulation research 40.5 (1977): 451-458.
Cerutti, C., et al. "Beat-to-beat stroke volume estimation from aortic pressure waveform in conscious rats: comparison of models." American Journal of Physiology-Heart and Circulatory Physiology 281.3 (2001): H1148-H1155.
Bernstein, Donald P. "Pressure pulse contour-derived stroke volume and cardiac output in the morbidly obese patient." Obesity surgery 18 (2008): 1015-1021.
Gödje, Oliver, et al. "Reliability of a new algorithm for continuous cardiac output determination by pulse-contour analysis during hemodynamic instability." Critical care medicine 30.1 (2002): 52-58.
Westerhof, Nico, Jan-Willem Lankhaar, and Berend E. Westerhof. "The arterial windkessel." Medical & biological engineering & computing 47.2 (2009): 131-141.