Interpretation of the central venous pressure waveform
This chapter is relevant to Section G6(ii) of the 2023 CICM Primary Syllabus, which asks the exam candidate to "describe the invasive and non-invasive measurement of blood pressure, including limitations, potential sources of error and the need for calibration". The college examiners have never expected their candidates to analyse any CVP waveforms and so the time-poor exam candidate can safely ignore this page and probably all the other pages in this CVP section.
Anatomy of the CVP waveform
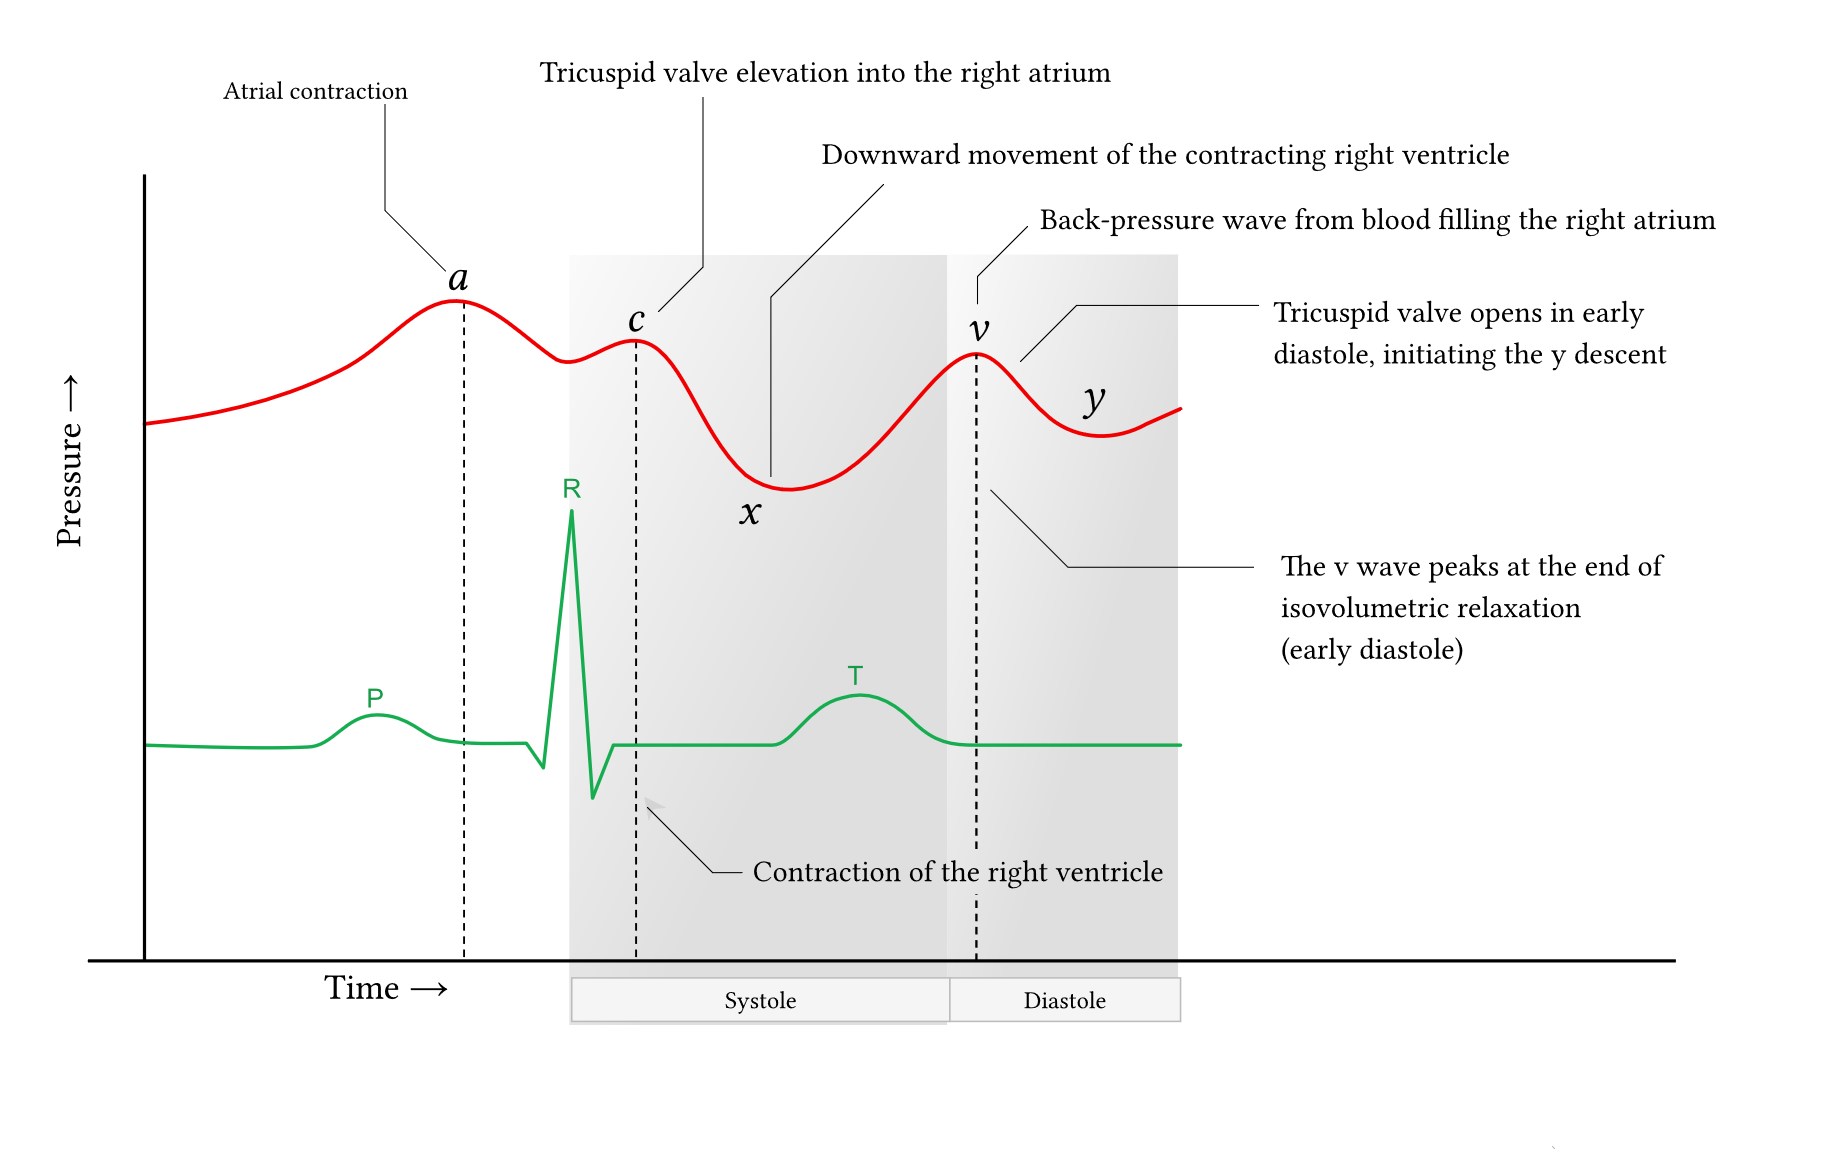
"The a wave results from atrial contraction, the c wave from atrioventricular valve closure and isovolumic ventricular contraction, and the v wave from ventricular ejection, which drives venous filling of the atrium."
(a) wave
- a is for atrium… this is the right atrial contraction.
- It correlates with the P wave on the ECG.
- It disappears with atrial fibrillation
- It reveals atrial flutter (in case you cannot make up your mind regarding whether it is flutter or just sinus tachycardia with a weirdly consistent rate of 150)
- A short PR interval (eg. tachycardia) will fuse it with the c wave.
(c) wave
- c is for atrioventricular valve closure and isovolumic ventricular contraction
- c is also for cusp… this is the cusp of the tricuspid valve, protruding backwards through the atrium, as the right ventricle begins to contract.
- It correlates with the end of the QRS complex on the ECG
(x) descent
- This is the movement of the right ventricle, which descends as it contracts
- The downward movement decreases the pressure in the right atrium. At this stage, there is also atrial diastolic relaxation, which further decreases the right atrial pressure.
- It happens before the T wave on the ECG
- The x descent or "x trough" can also extend into an x' descent,
With sinus bradycardia, which prolongs diastole, an additional mid-late diastolic plateau pressure, termed an h wave, inay be inscribed
(v) wave
- As blood fills the right atrium, it hits the tricuspid valve and this is the back-pressure wave.
- It happens after the T wave on the ECG
- This timing corresponds with late systole
- It peaks just before the tricuspid valve opens, during isovolumetric ventricular relaxation; and so it is technically a diastolic phenomenon.
- It also gives an impression of tricuspid competence.
- A huge V wave is suggestive of tricuspid regurgitation, as it represents blood flowing back out of the contracting right ventricle; in this situation the V wave would be the most prominent wave, and would reach right ventricular systolic pressure ( ~ 30mmHg)
(y) descent
- This is a pressure decrease caused by the tricuspid valve opening in early ventricular diastole.
- This happens before the P wave of the ECG
- A loss of y-descent suggests tamponade; it means there is restriction to right ventricular filling.
References
Mark, Jonathan B. Atlas of Cardiovascular Monitoring. Churchill Livingstone, 1998, pp. 16–18.
Raut, Monish S., and Arun Maheshwari. “Unusual bifid ‘V’ wave in central venous pressure.” Saudi Journal of Anaesthesia 7.2 (2013): 218–219. doi:10.4103/1658-354X.114064.